What is longboarding and how can we answer that with beautiful data?
Challenge
Longboarding is a longstanding passion of mine, and I often get questions from non-longboarders about the boards I ride, prices to get started, and where the best places to skate are.
Infographics are the best way to digest information quickly and beautifully, so how else could we answer this question than with an infographic?
Time
2 months
2014
Tools
Adobe Illustrator
Sketch
Tableau
Excel Spreadsheets
Python
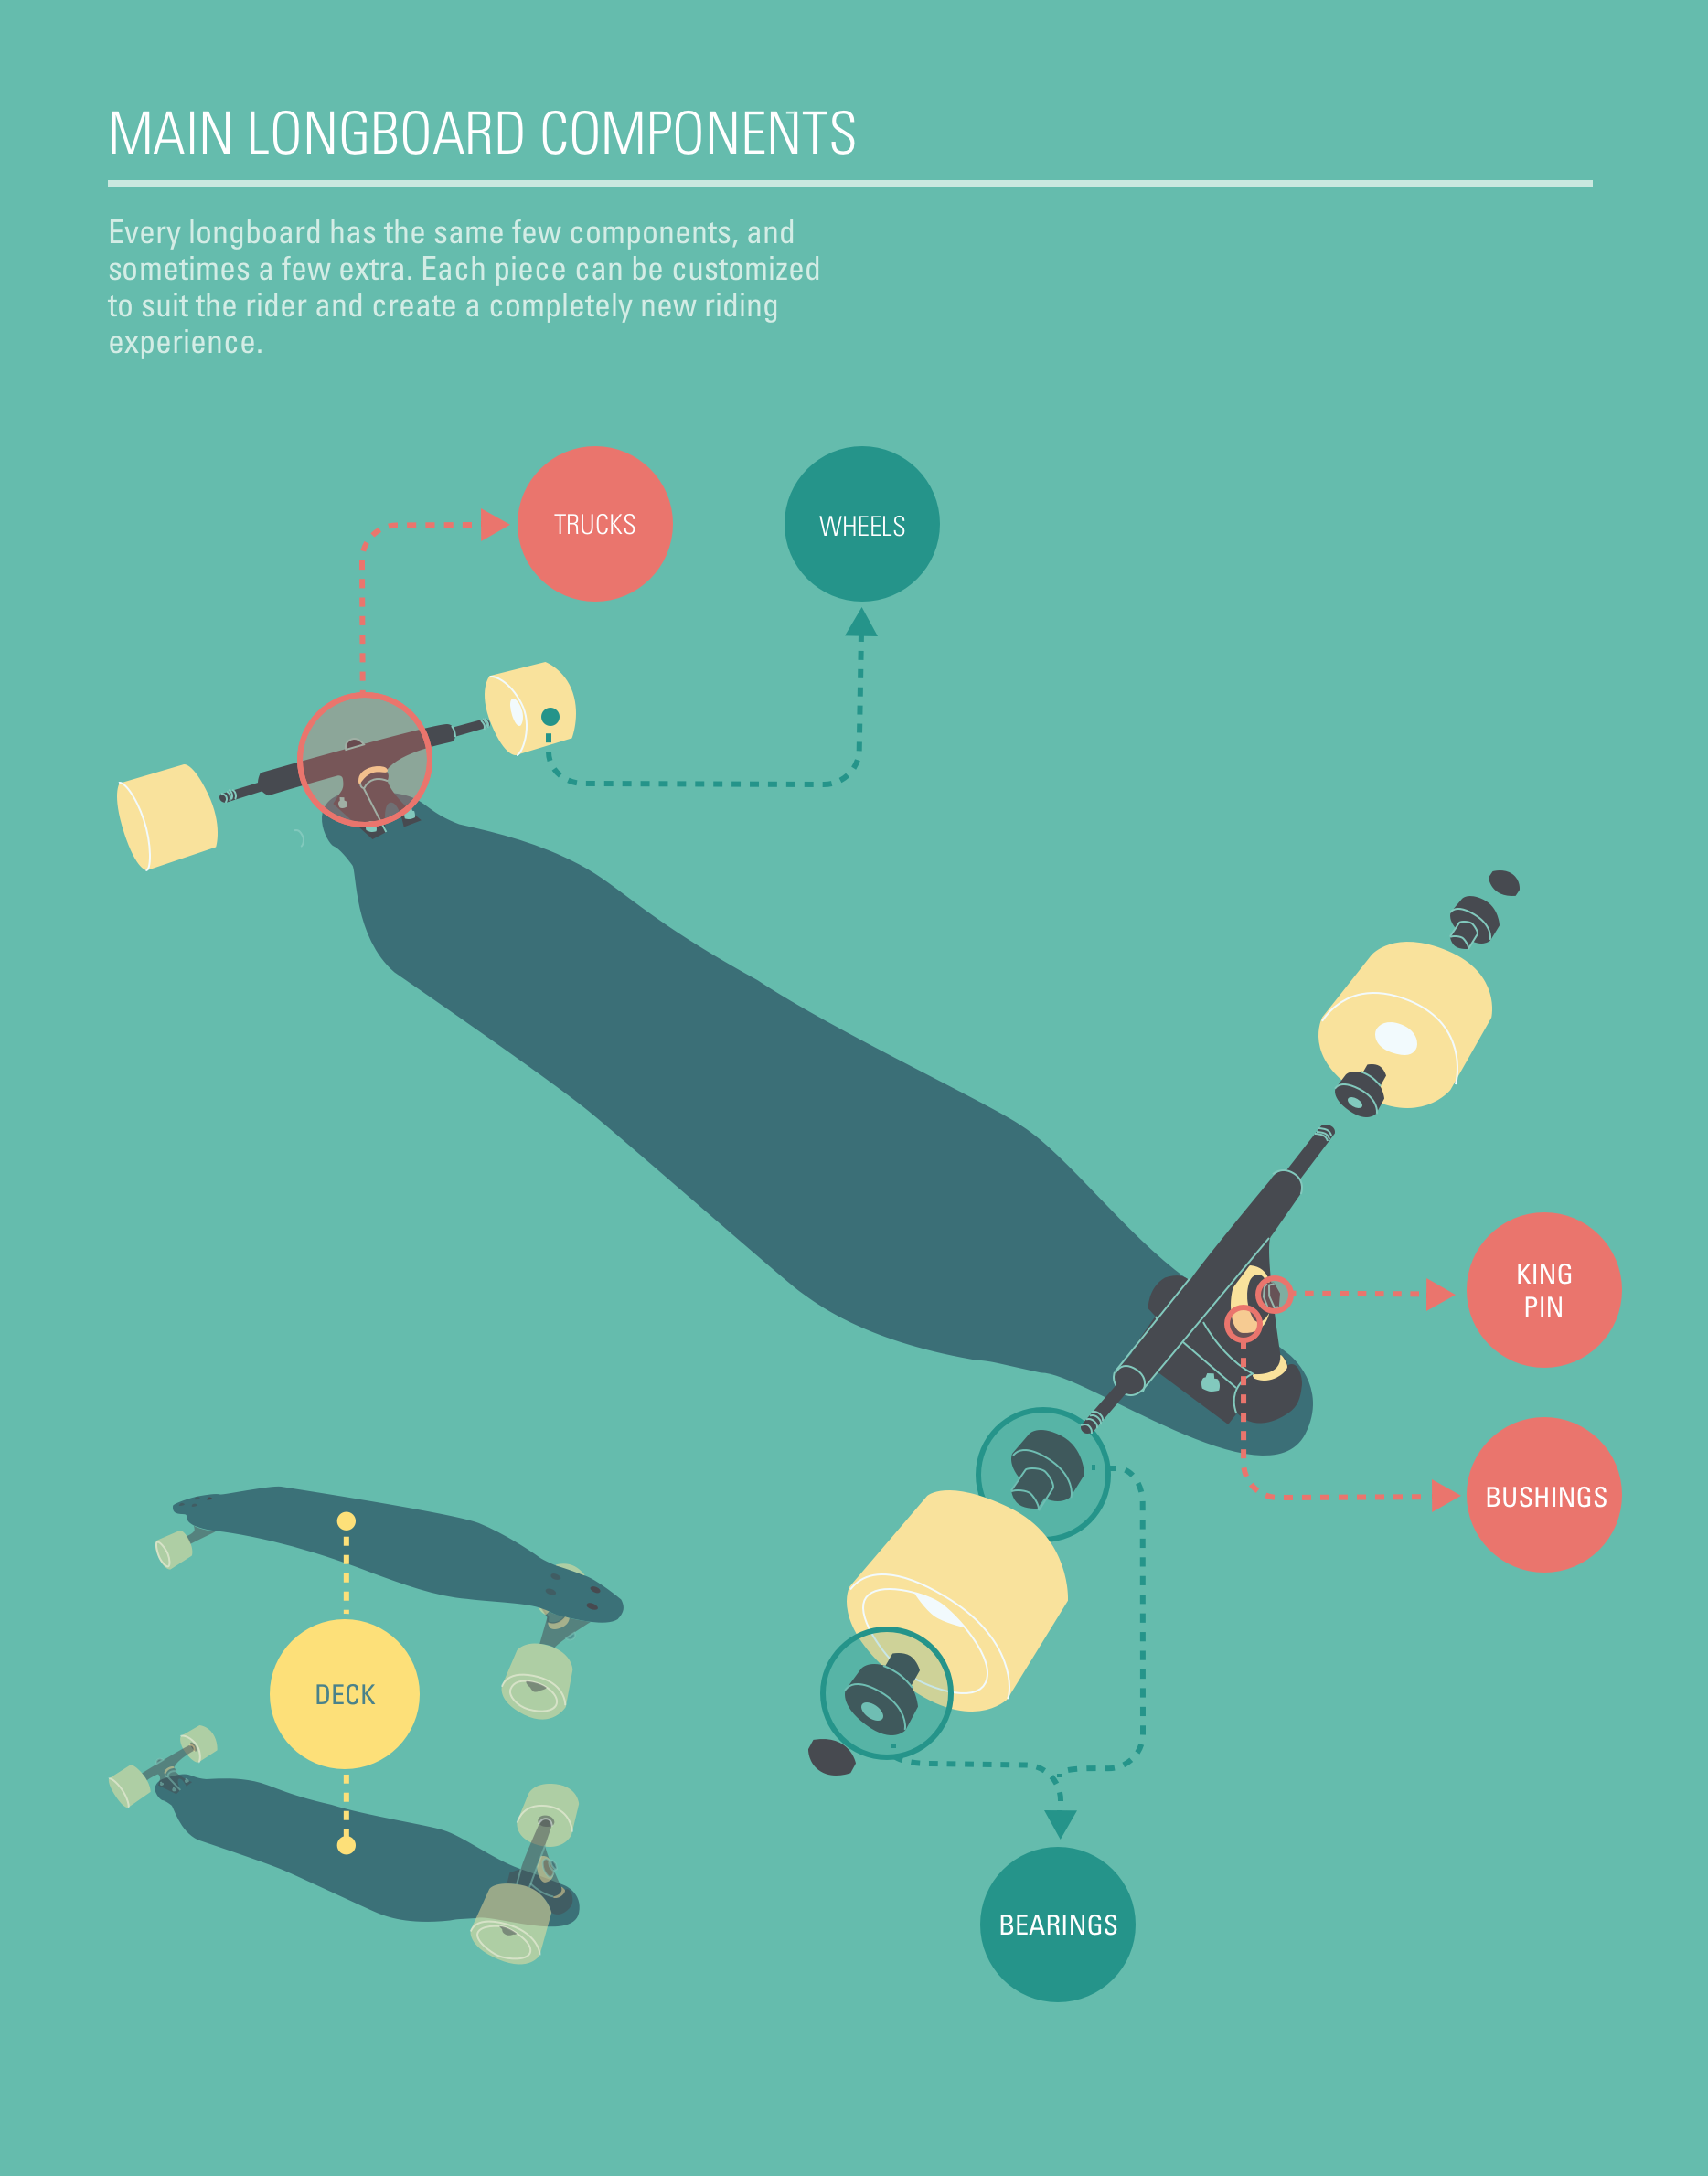
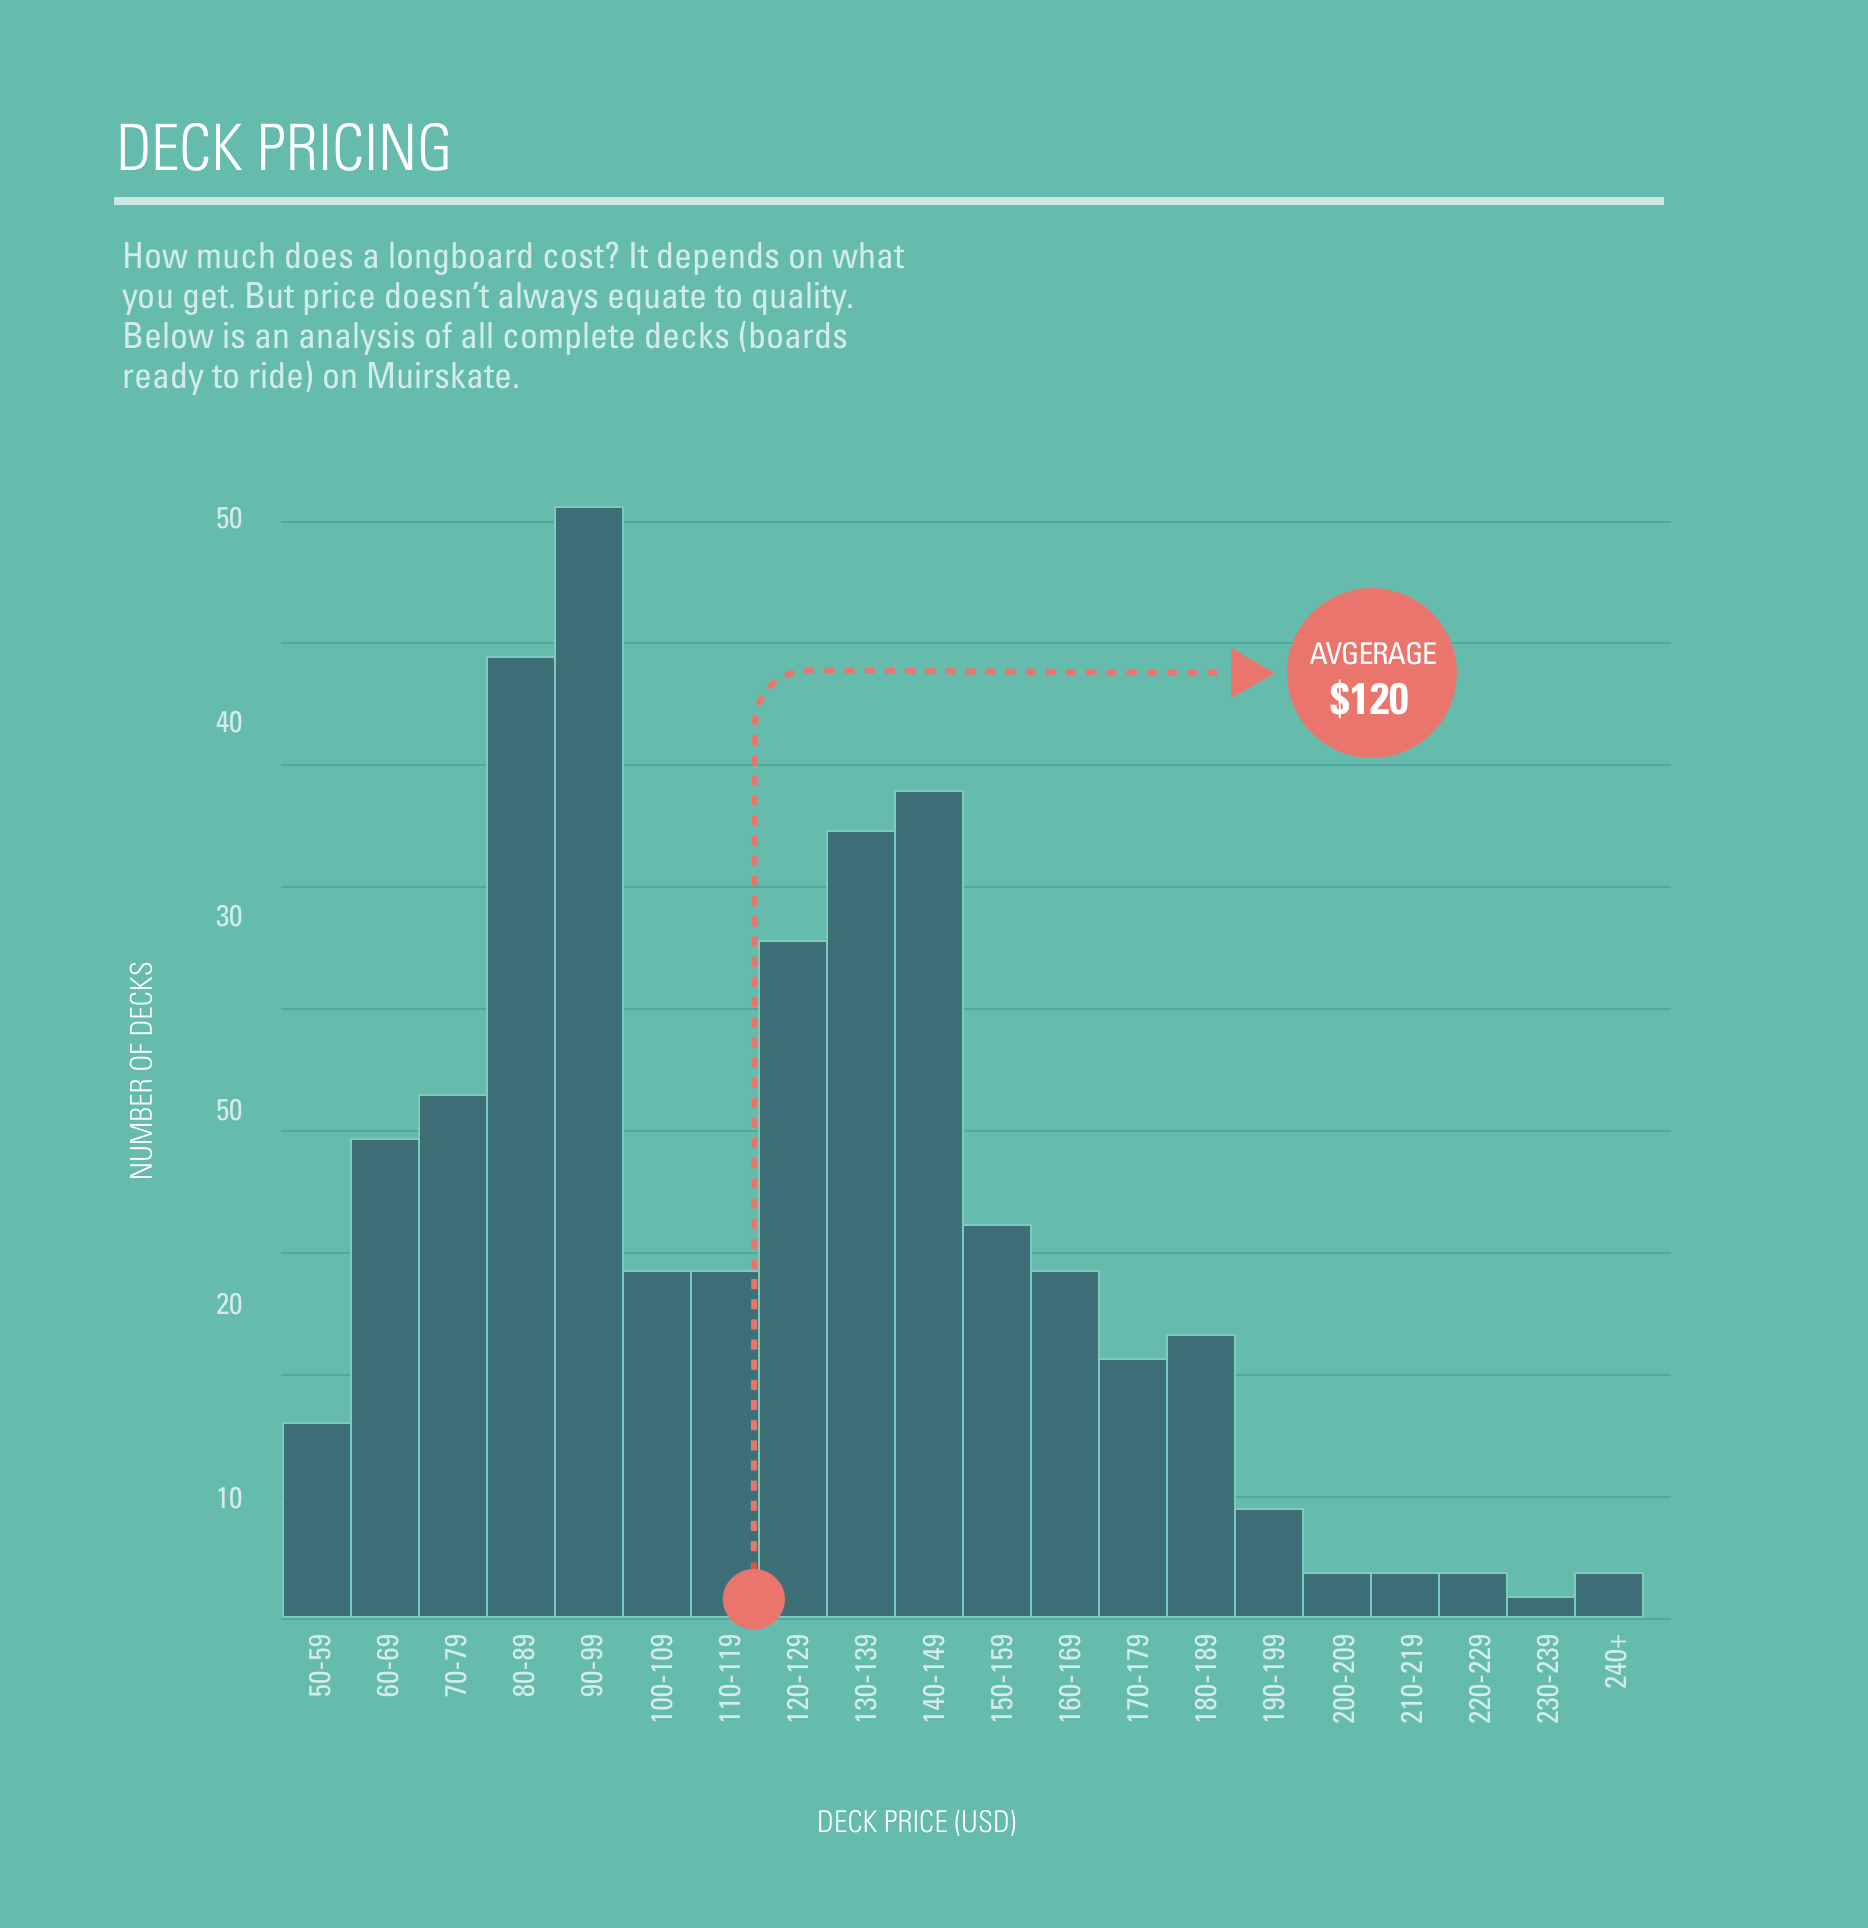
Individual graphics
PROCESS
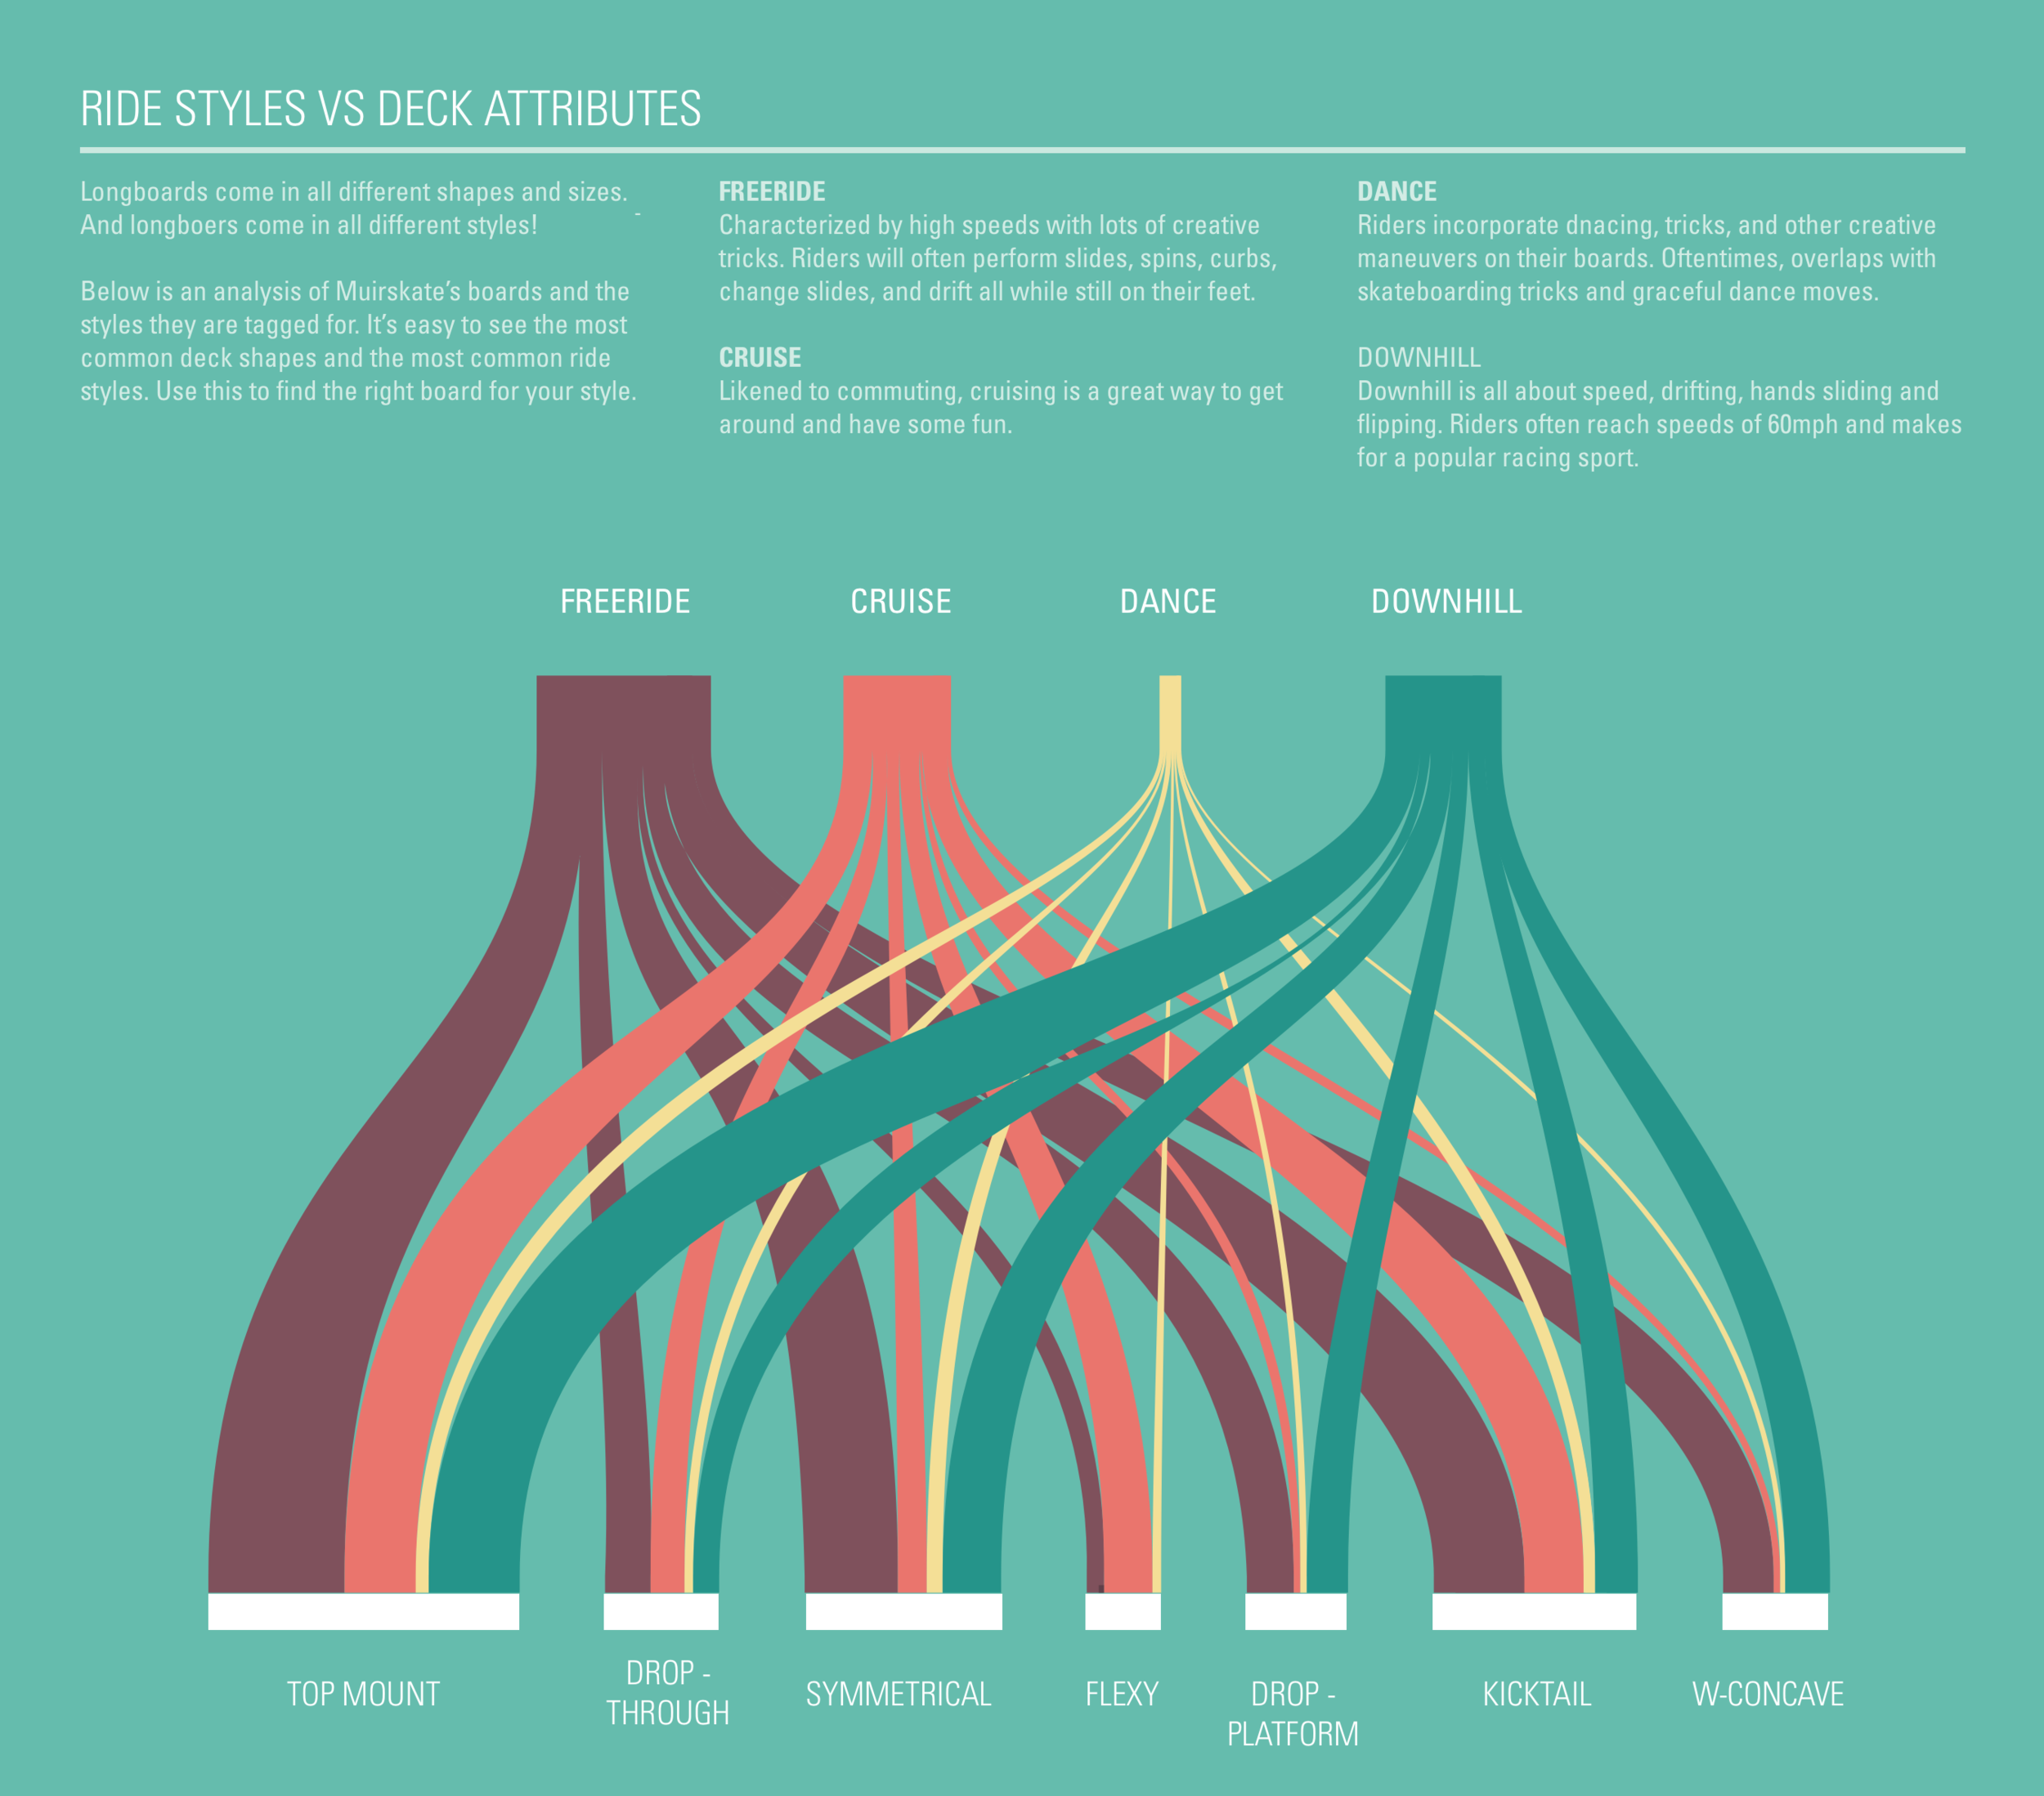
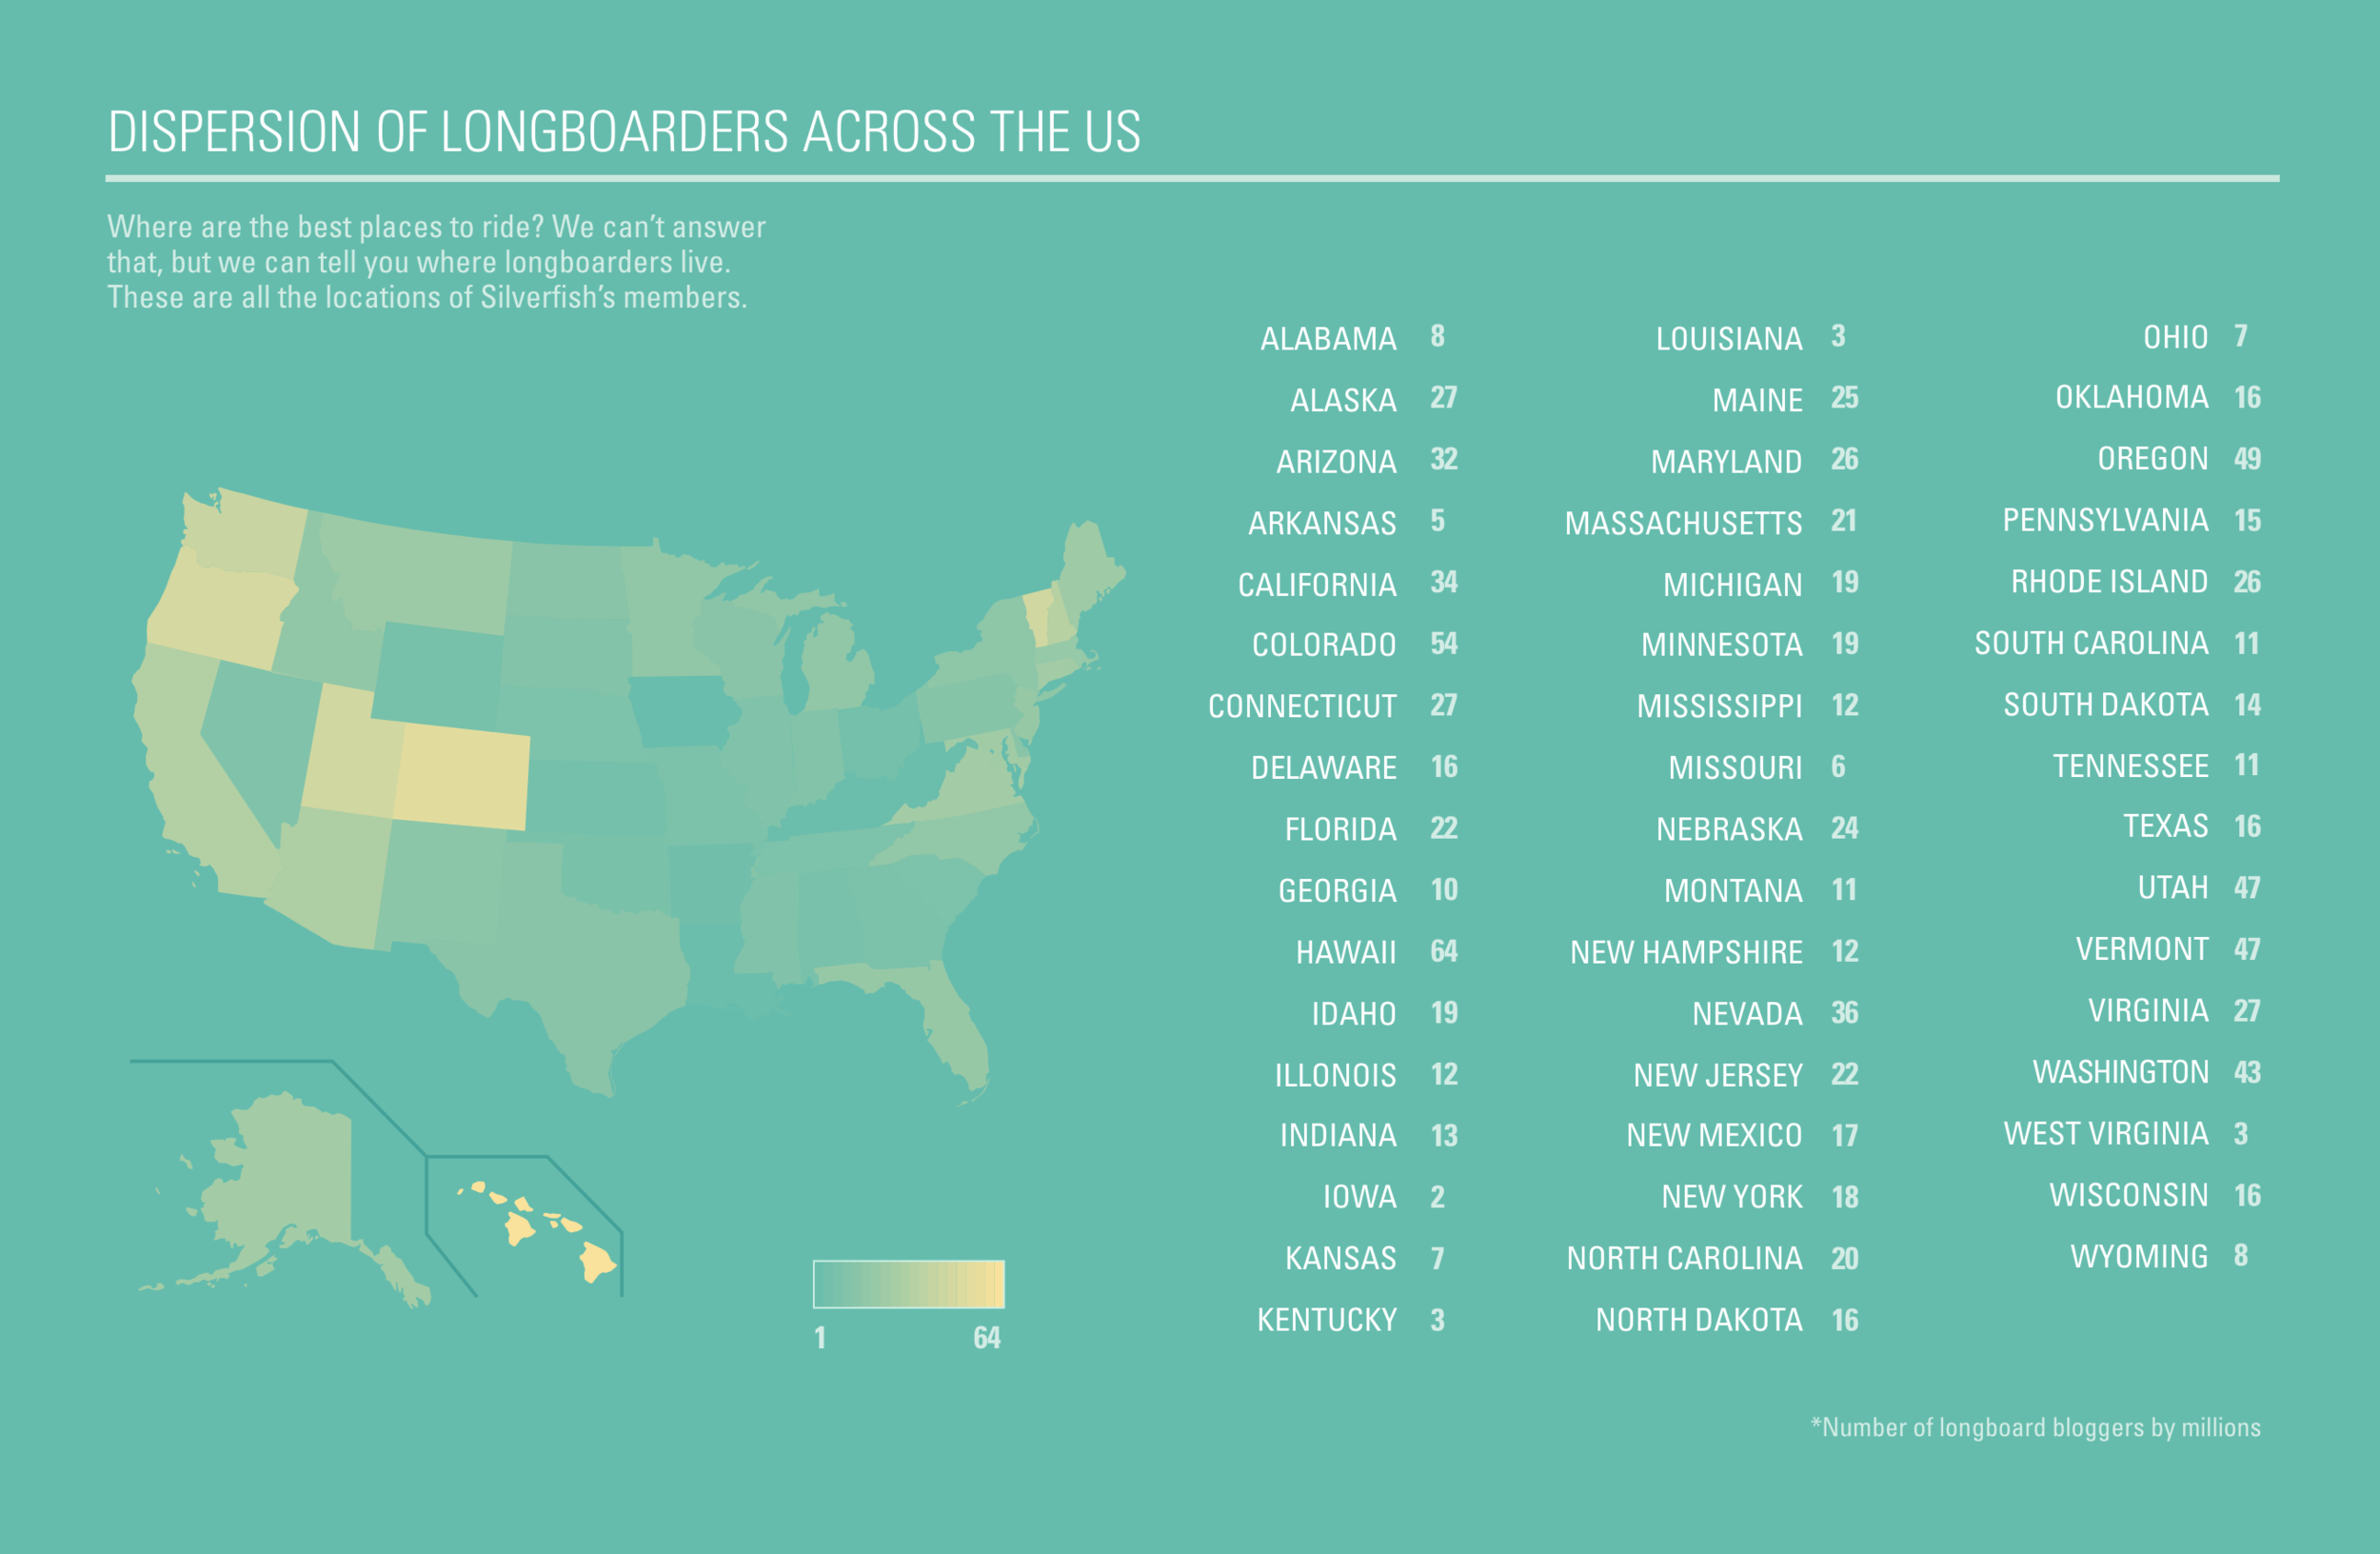
Using Python code, I scraped data from Muirskate and Silverfishlongboarding, then analyzed it in Tableau and Excel Spreadsheet.
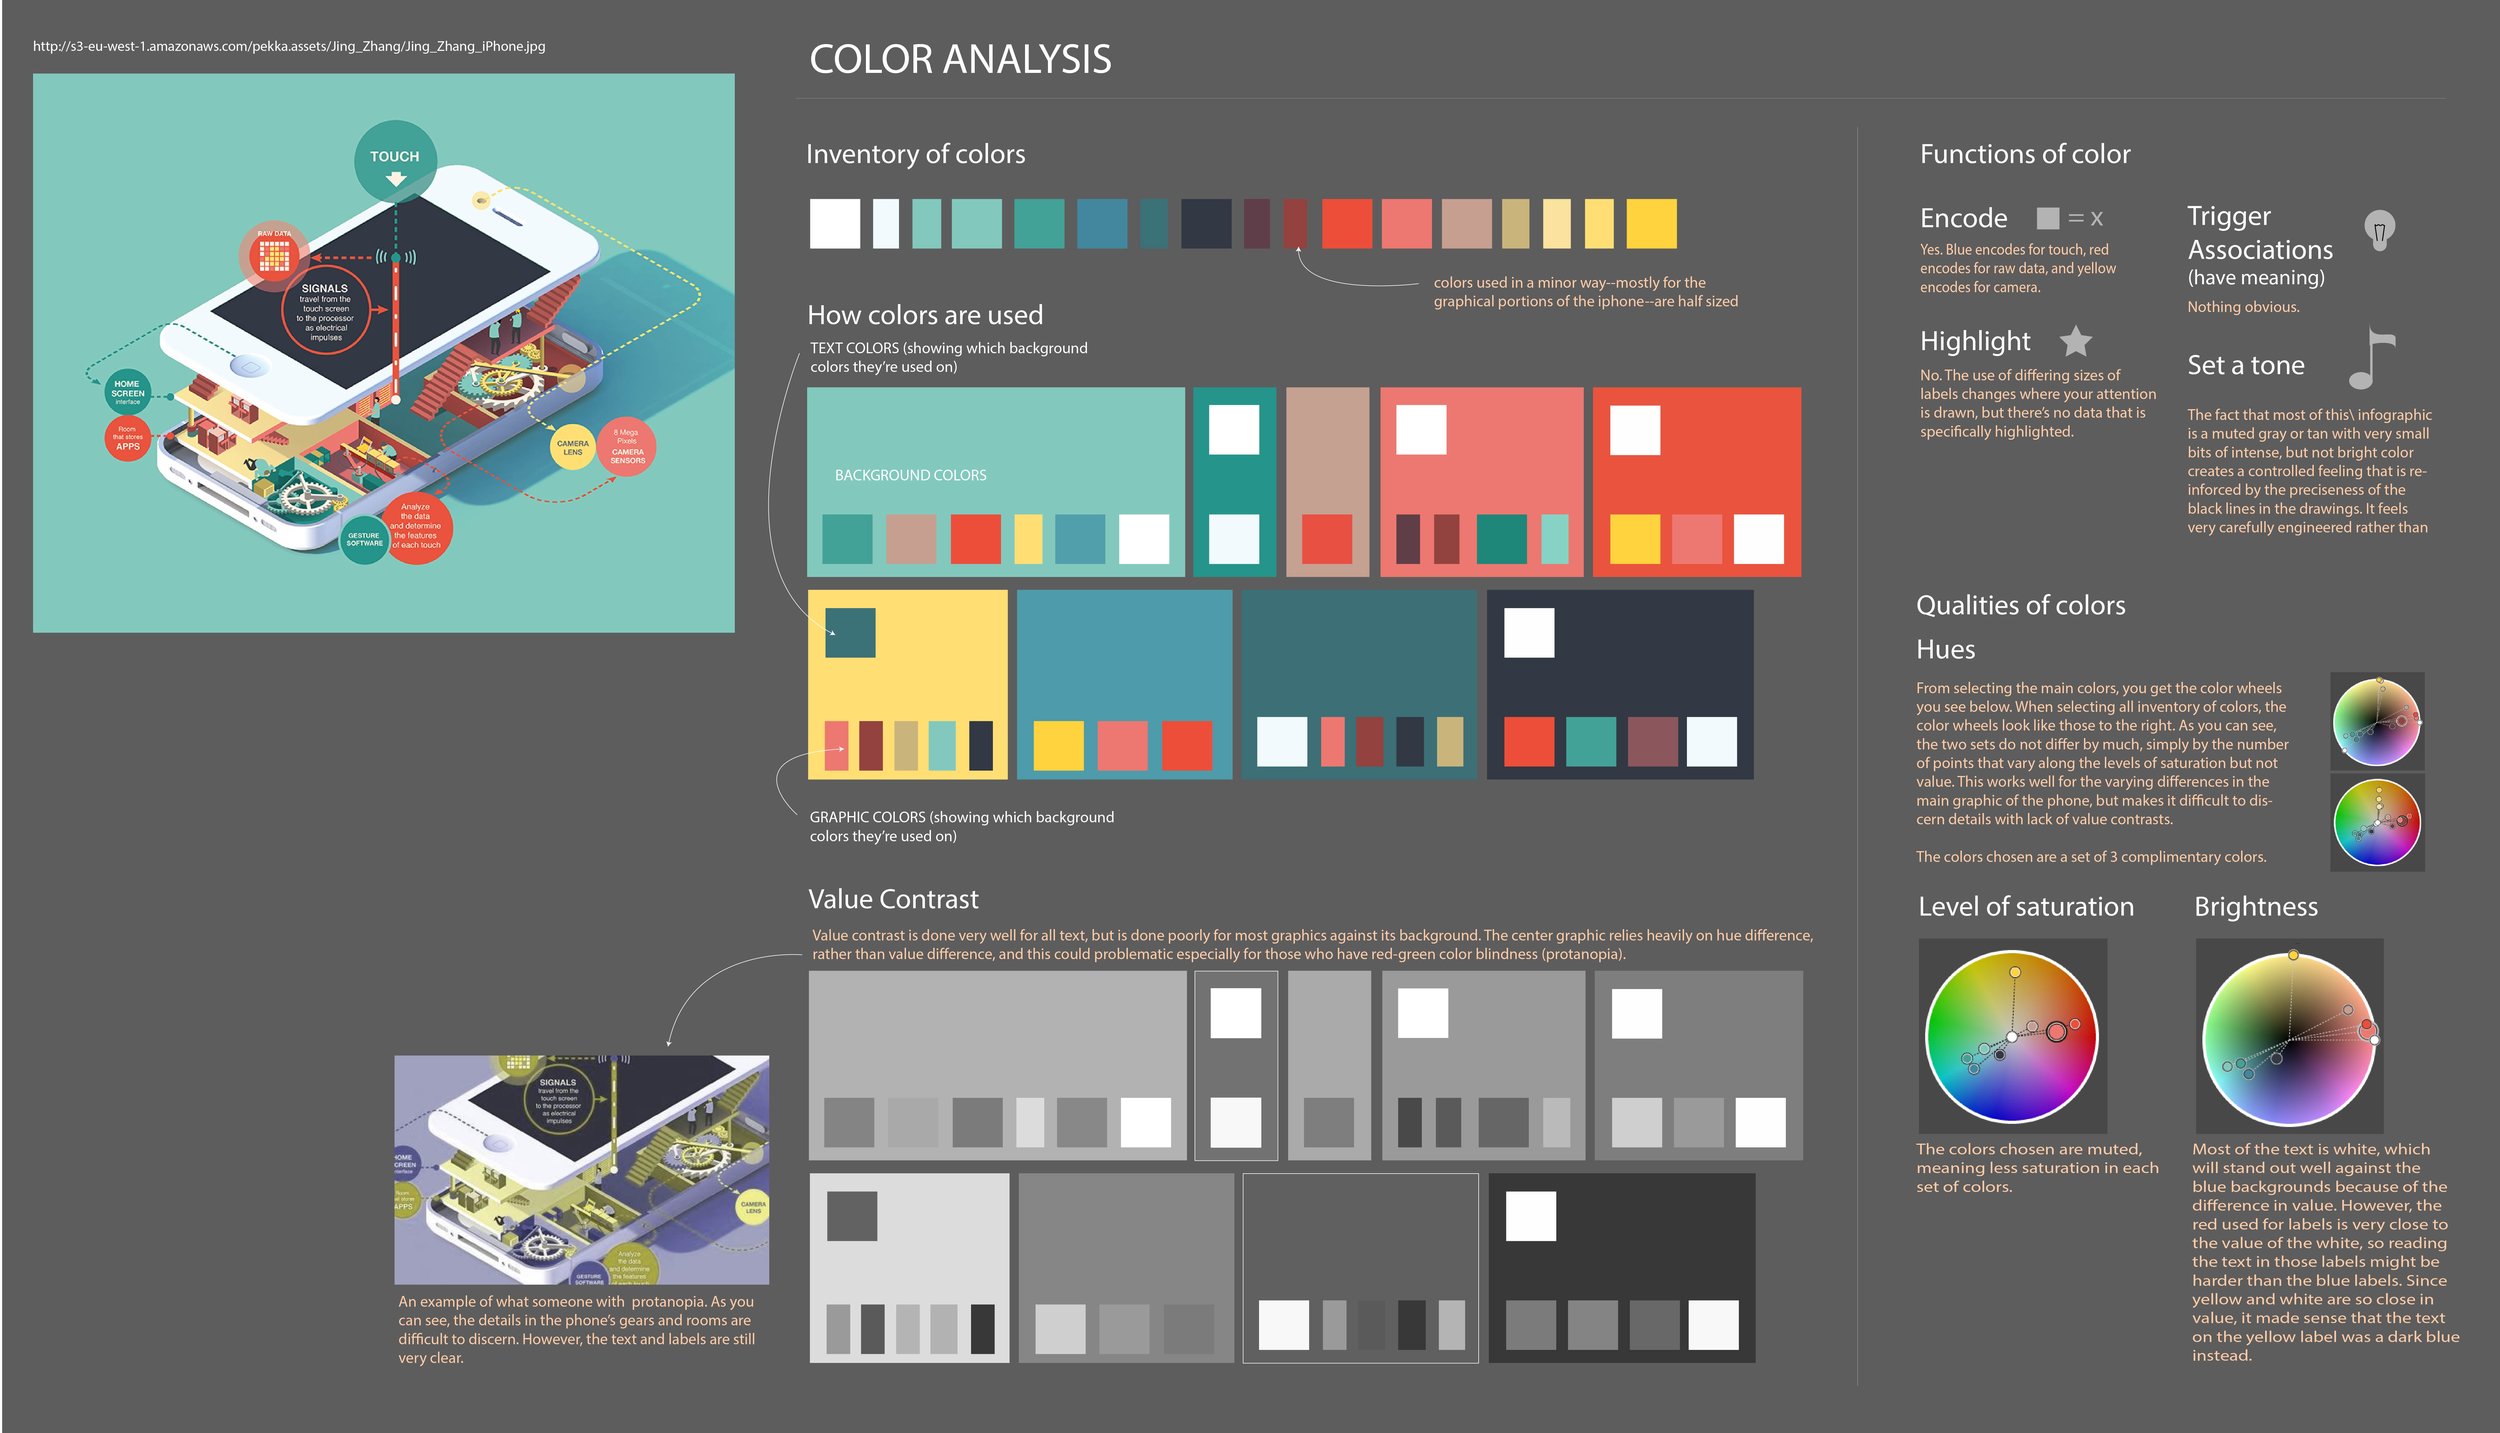
I found infographics online that exemplify good design, and completed a color analysis to use as inspiration for my designs.
The infographic icons and graphics were made in Illustrator, then put together in Sketch.